In a single frame, a distant bird and a small drone are the same few dark pixels; one camera cannot measure range, so blob size proves nothing. The difference lives in time and sound. As a tracker follows each dot, its path becomes a shape: a bird's track pulses with the wingbeat, curves through turns and changes speed; a multirotor never flaps, stops in the air and can slide sideways without turning. Sound is independent evidence: a rotor emits narrowband tones at its blade passing frequency and harmonics. The decision is a confidence score built from these features, at the edge, on the mast.
In short
- In our worked example, at 400 m a 0.35 m drone covers about 13 pixels and a starling about 14; without range, size says nothing.
- The difference is the track's shape over time: wingbeat pulse, speed pattern, hovering, turning, flock context. Each can be fooled, so the decision is a confidence score.
- Cut tracks for the classifier by on-screen length, not time.
- In sound, the envelope period misleads: beating between two rotors can mimic a wingbeat. Tonality decides.
- Camera and microphone paths meet in the box on the mast; the metric is fps per watt, and for the operator, glass-to-glass delay.
Why is one frame not enough?
Our film opens with this question: at first light the sky over the marsh is full of birds, and in a frozen frame every distant thing is the same dark dot. It is a concept film: the marsh, birds, drone and mast are our own 3D animation, and the boxes and tracks on screen are not detector output. The geometry of the problem is real.
Worked example (assumptions: drone width 0.35 m, range 400 m, pixel pitch 3.45 µm, focal length 50 mm): angular size 0.35 / 400 = 0.875 mrad; angle per pixel (IFOV) 3.45 µm / 50 mm = 69 µrad; the drone covers 0.875 mrad / 69 µrad ≈ 12.7 pixels. At this range one pixel is about 2.8 cm.
With wingspans from Pennycuick's measurements of migrating birds, the same camera shows a starling (0.384 m) as ≈ 13.9 pixels and a black-headed gull (0.963 m) as ≈ 34.9 pixels; the gull shrinks to the drone's 12.7 pixels at about 1.1 km. One camera does not measure range, so "small and close" and "large and far" leave the same blob. With the same optics, a sensor 2448 pixels wide sees only about 9.7° horizontally, which is why the camera in the film sits on a pan-tilt head. Our C-UAS architecture article (in Turkish) covers the detector side; this one is about classification.
Which features does a track carry?
A track is a time series: position, velocity, blob area and brightness. In the film, one track never flaps, flies straight at constant speed, stops in the air and then slides sideways without turning; no bird leaves that shape.
| Feature | Bird | Multirotor | Where it misleads |
|---|---|---|---|
| Wingbeat pulse (blob area, brightness) | 2.9–18.2 Hz depending on species | None | Gliding birds do not flap; at low sampling rates the frequency folds |
| Speed pattern | Speed undulates in flap-gliding, height in bounding flight | Straight line, constant speed | Soaring raptors and fixed-wing drones also fly smoothly |
| Hovering | Rare | Strong sign | A hunting kestrel hovers |
| Change of direction | Turns on an arc while moving | Stops, then slides sideways without turning its body | Tracker errors or head motion create a fake sideways slide |
| Flock context | Same heading and speed as neighbours | Usually alone | A lone bird; a drone passing close to a flock |
| Acceleration profile | Mostly forward | Any direction; hard braking and fast starts | A gust shakes both tracks |
For wingbeat frequency, the reference is Pennycuick's study of 16 migrating species passing Falsterbo: 2.88 Hz for the red kite, 2.91–3.27 Hz for four gull species, 5.61 Hz for the wood pigeon, 10.6 Hz for the starling and 18.2 Hz for the chaffinch. In flap-gliding raptors speed undulates while height barely changes; the chaffinch flies by bounding, folding its wings and falling freely, so its path curves down and up. At range the strongest signal is usually the blob area changing as the wings open and close; body motion of a few centimetres is less than one pixel at 400 m.
Worked example: the camera runs at 30 fps, the heavy detector runs on one frame in four, and the wingbeat is read only from the detector's box. Effective sampling is 30 / 4 = 7.5 Hz, so the Nyquist limit is 3.75 Hz; a wood pigeon's 5.61 Hz folds to |5.61 − 7.5| = 1.89 Hz. The fix: read the pulse from a cheap measurement on every frame, in a small window at the track's predicted position.
The table's last column is the real message: every feature can mislead on its own, so each one adds evidence along the track. Hovering plus a wingbeat points to a kestrel; hovering with no pulse and a rotor tone points to a drone.
Why limit track length in pixels, not seconds?
We learned this while making the film, drawing tracks on screen. First we limited tracks by time. A drone is much faster than a bird, so the same duration left a tail of a few pixels behind the bird and a line across the whole frame behind the drone. Shortening the time only moved the imbalance to the other end. We switched to pixels: each track is kept up to a fixed on-screen length, bird and drone leave tracks of similar size, and the difference stays in the shape.
A classifier needs the same. Shape features such as curvature and change of direction become comparable when tracks are cut to similar length and resampled to a fixed number of points; frequency features such as the wingbeat need a time window. Because the image moves as the pan-tilt head turns, keep the track in azimuth and elevation using each frame's head angle; at a fixed focal length this equals on-screen length.
# Sketch: cut the track by angular length, not time, then resample by arc length.
# Point: (azimuth * cos(elevation), elevation) in radians; list is newest first.
import numpy as np

def track_window(points, max_length):
    kept, total = [points[0]], 0.0
    for newer, older in zip(points, points[1:]):
        total += np.hypot(*np.subtract(newer, older))
        if total > max_length:
            break
        kept.append(older)
    return np.array(kept[::-1])

def resample(track, n=32):
    s = np.concatenate([[0.0], np.cumsum(np.hypot(*np.diff(track, axis=0).T))])
    if s[-1] == 0.0:
        return None  # hovering target: no shape, but hover evidence
    t = np.linspace(0.0, s[-1], n)
    return np.column_stack([np.interp(t, s, track[:, 0]), np.interp(t, s, track[:, 1])])
Sound: rotor tone, wingbeat pulse and the beating trap
The film's second cue is sound: "A wingbeat is a slow pulse. A rotor is a steady tone."
A propeller's blade passing frequency is revolutions per second times the number of blades; a two-blade propeller at 6000 rpm gives 100 × 2 = 200 Hz. On a quadcopter measured by NASA Langley, each rotor shows its own line near 200 Hz while hovering; rotor speeds differ slightly because of small differences in blades and motors, centre-of-gravity offsets and wind.
When two close tones add up, the amplitude rises and falls at a rate equal to the difference of their frequencies; this is beating. Worked example: with fundamentals of 200 Hz and 203 Hz (6000 and 6090 rpm on two-blade propellers, a 1.5% speed difference), the envelope swells three times per second; Pennycuick measured 2.91–3.27 Hz for gull wingbeats.
We fell into this trap in our own film. In the first mix, a small speed difference between two rotor sounds produced a beat close to the wingbeat rhythm, and "a rotor is a steady tone" did not hold up to the ear. The sound is synthetic design, not a field recording; we analysed its envelope and spectrum and fixed it. The lesson is real: a naive classifier that looks only at envelope period would have called this rotor a wing.
The difference is tonality: rotor energy sits in narrow bands at multiples of a shared fundamental, while in the film we designed the wingbeat as a slow, broadband pulse with irregular intervals. So pair the envelope period with a narrowband energy ratio. Tonality alone is not enough either: pure-tone song is common in birds, and ground vehicles also produce harmonic series. A rotor gives itself away with a harmonic series sitting on a blade passing frequency and shifting with the manoeuvre.
for each audio window (in the band of interest):
  narrow = energy within ±Δf of the strongest peaks / total energy in the band
  series = share of peaks that sit on integer multiples of one f0
  env    = dominant period in the envelope's modulation spectrum

  rotor evidence  ← narrow high AND series high   (envelope period alone is not evidence)
  song suspect    ← narrow high BUT no harmonic series (single line)
  wing evidence   ← narrow low AND slow, irregular pulse in the envelope
Microphone array: where does direction come from?
One microphone can hear a rotor but not locate it; direction comes from the time difference of arrival (TDOA) between capsules. For a distant source the delay is τ = d · sin θ / c (d capsule spacing, θ angle of arrival, c speed of sound); the classic estimator is generalized cross-correlation (Knapp and Carter, 1976). Worked example (capsule spacing 0.20 m, 48 kHz sampling, 343 m/s at 20 °C): the largest delay is 0.20 / 343 ≈ 0.58 ms, about 28 samples; straight ahead of the pair, one sample is about 2° of direction.
The limits are known: among acoustic studies reviewed by Svanström and colleagues, the longest reported detection range was 290 m, with a 120-element array. The author of the open-source EchoHawk pipeline likewise treats acoustics as one layer of a multi-sensor system, given its shorter range than radar and its sensitivity to wind and broadband noise. The sound path's main job is to answer "is there a rotor in that direction?" and turn the head there.
Two paths, one box: how to fuse them
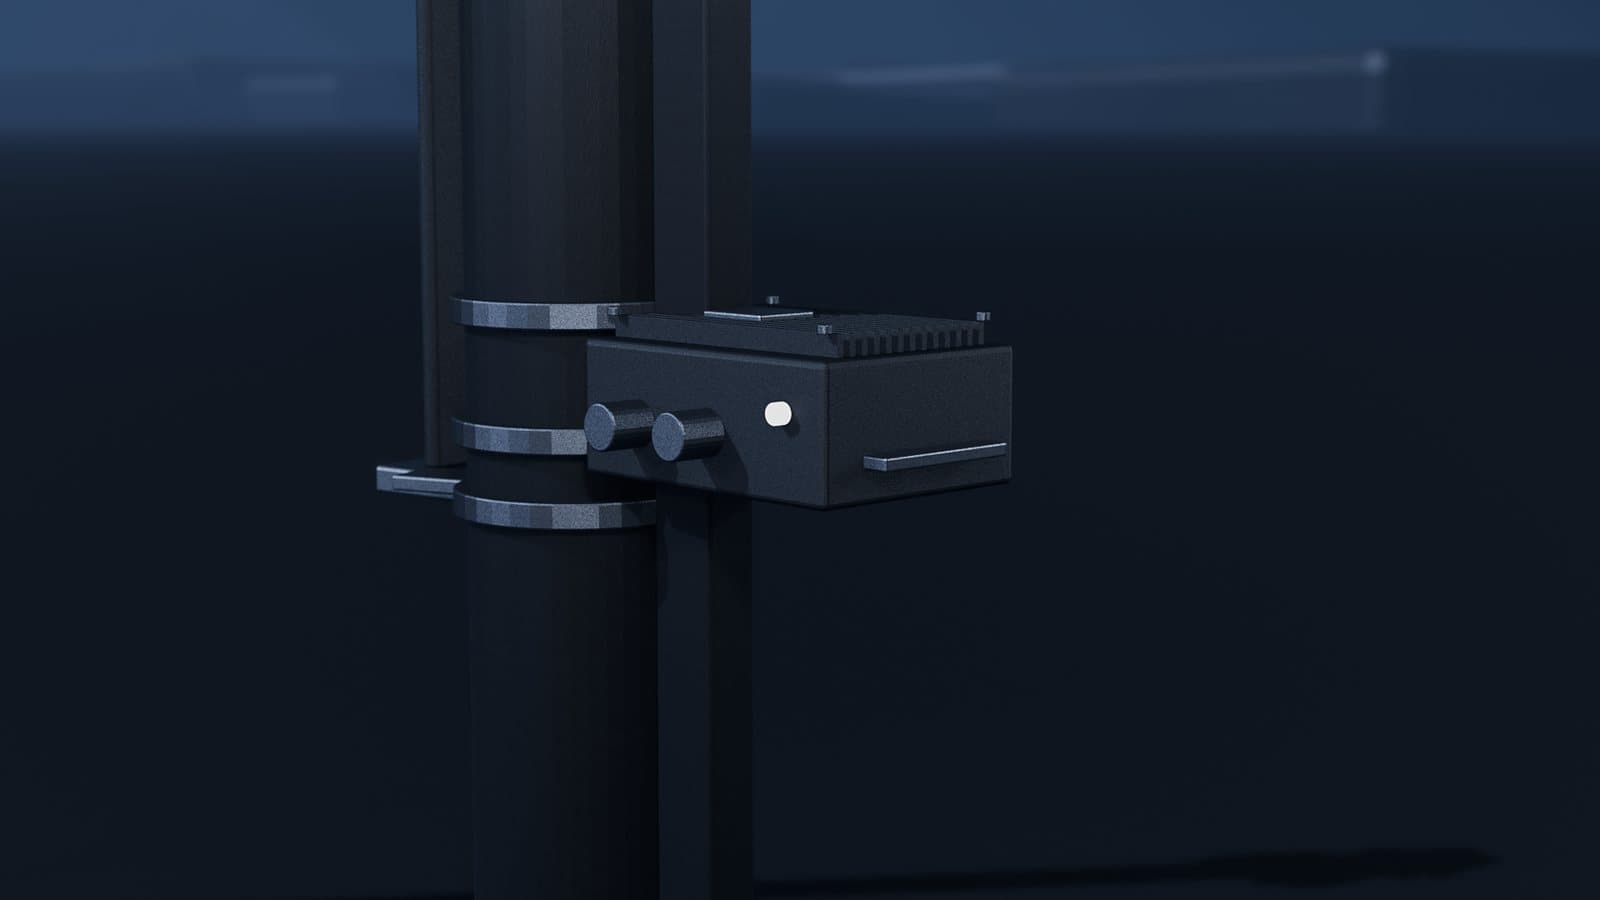
In the film, the camera path (detection, tracking, track features) and the sound path (spectral features, direction) meet in the box on the mast, at one of two levels.
| Decision-level (late) fusion | Feature-level fusion | |
|---|---|---|
| What is combined | Each path's class and confidence | Track and sound features in one vector |
| Precondition | Shared time window; audio direction matched to a track | Tight time alignment between frames and audio samples; data labelled on both channels |
| Strength | Paths are tested separately; if one drops out, the other still works | Can learn relations across channels |
| Weakness | Averaging during a conflict erases information | A missing channel corrupts the input; needs much more data |
The system of Svanström and colleagues, with infrared and visible cameras, a microphone and a pan/tilt platform, uses late fusion: class outputs and confidence scores are combined and smoothed over about one second. In a ten-minute recording, requiring at least two sensors kept every single-sensor false detection from becoming a system alarm.
At either level, a sound direction counts as evidence for a track only if it matches that track's azimuth; this matching and time alignment is the basis of sensor fusion work. If the camera says "bird" while a stable harmonic series comes from the same direction, do not average: it may be a drone near the flock, or the sound may have another source. Mark the track "conflicting" and collect evidence: turn the head, zoom in, extend the track. Silence is not evidence for a bird: the target may be out of range or masked by wind.
Why on the mast: fps per watt and glass-to-glass delay
We discussed the cloud option in the C-UAS article; classification adds another reason. Worked example (assumptions: 2448 × 2048 pixels, 8-bit, 30 fps): raw video is ≈ 150 MB per second, about 1.2 Gbit/s, so a radio link can carry it only compressed, and lossy coding easily smooths away the pulse of a blob a few pixels wide. The microphone channels must also stay sample-aligned. With computation next to the sensors, a lost link does not blind the mast.
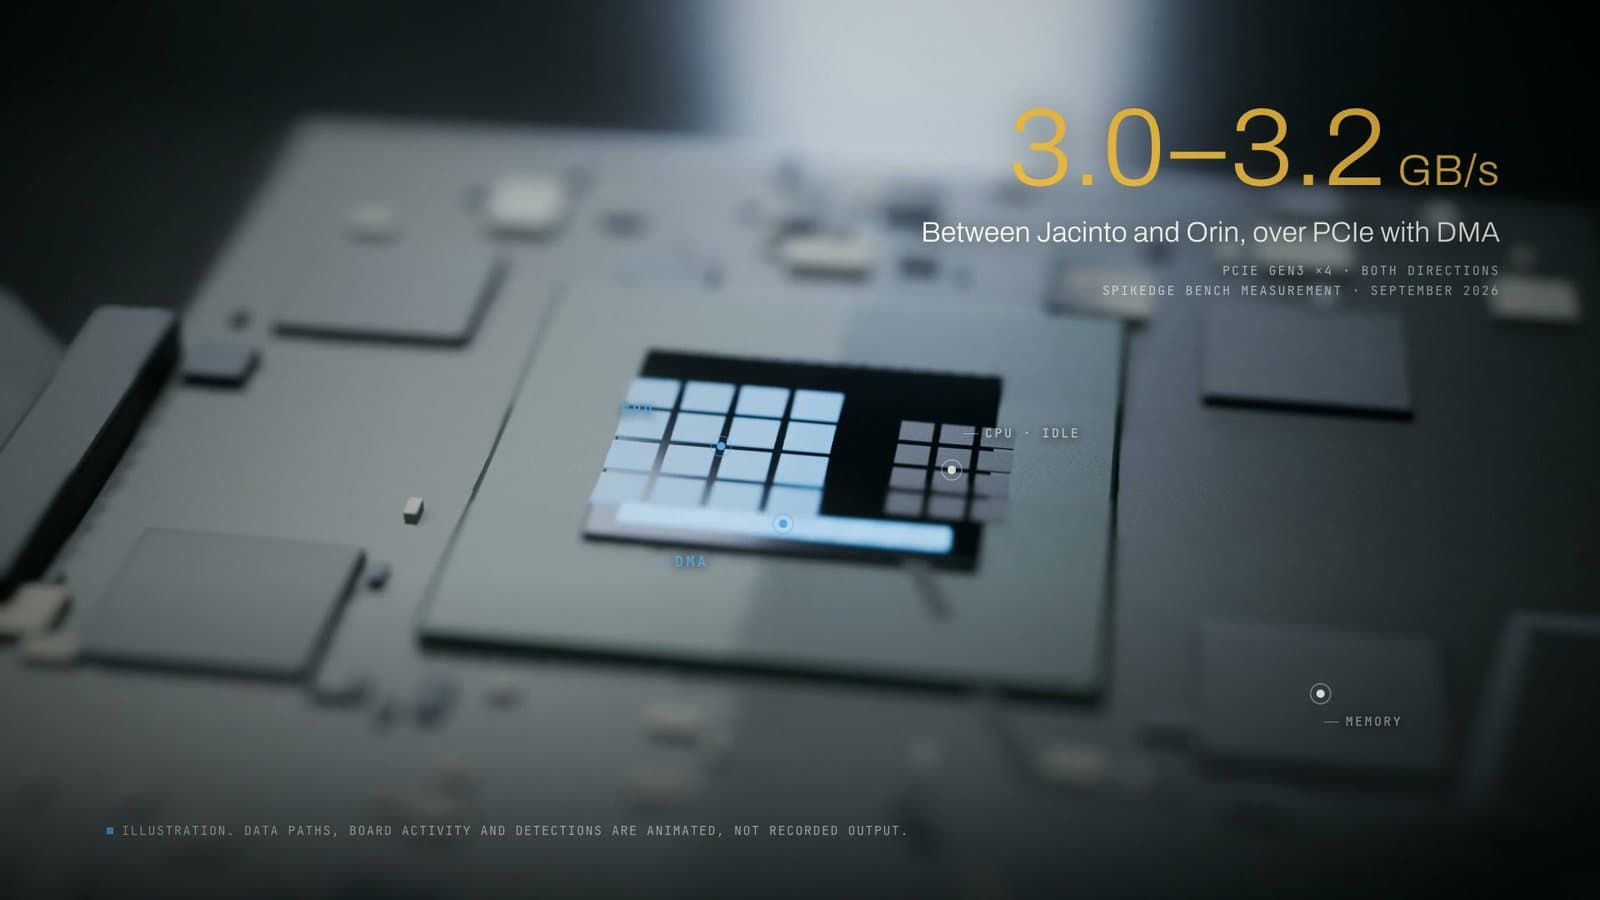
Power on a mast is limited, and the box must shed its own heat. So the metric is fps per watt: end-to-end frame rate from camera to track output, divided by watts at the enclosure input. The tools in the film's credits (Jetson Orin NX, TensorRT, INT8, DLA) are the chain we work with; our edge AI inference method note and edge AI pipeline page describe how such a measurement is set up. The case study on our site places the Orin NX on an aircraft; the mast in the film is a concept.
The operator sees the picture a moment later, and that delay is measured glass to glass: from when an event's photons pass through the camera lens until the matching photons leave the display glass. In the Bachhuber and Steinbach method, using an LED and a phototransistor, the result is a distribution; since the operator decides from this picture, its tail matters more than its mean.
What we would measure
There are no figures in the film; when we publish one, its setup and method will sit next to it. We would measure:
- end-to-end fps and watts at the enclosure, under the same load;
- the distribution of glass-to-glass delay and its worst case;
- a confusion matrix by class and range, and false alarms per hour on bird-heavy mornings;
- the second of the track in which the confidence threshold is crossed.
Radar micro-Doppler: the path the film leaves out
Our film has no radar, but there is a third path: a spinning propeller and a flapping wing create sidebands around the main Doppler frequency of the radar echo (micro-Doppler). In Rahman and Robertson's measurements at 24 GHz and 94 GHz, the drone signature shows propeller flashes spread wide on both sides, and the bird signature shows periodic flashes at the wingbeat frequency without that spread. The difficulty remains: birds are similar in size to drones and fly at similar altitudes and speeds.
Where it goes wrong
- Deciding on one feature. Kestrels hover; soaring birds fly straight without flapping.
- Sampling the wingbeat at the wrong rate. If the pulse is read only from a detector that runs every N frames, the frequency folds.
- Writing head motion into the track. If pan-tilt angle and frame come from different instants, head motion appears as fake drift; a tracker that swaps targets does the same.
- Trusting the envelope period. Rotor beating can land on a wingbeat rhythm; check the narrowband ratio and the harmonic series.
- Treating tonality as a rotor. Pure-tone song and vehicle harmonics are tonal too.
- Treating silence as evidence. Range and wind can make a rotor inaudible.
- Evaluating at clip level. If slices of one recording land in both training and test sets, performance looks inflated; split by recording session.
What this article cannot tell you
- There is no field data: we give no accuracy or false alarm rate for any classifier.
- The film is a concept film: the marsh, birds, drone and mast are our 3D animation; boxes, tracks and labels are not detector output. The sound is synthetic design.
- The C-UAS case study on our site places the Orin NX on an aircraft; we are not describing a system installed on a mast.
- Literature numbers belong to the conditions of those studies; Pennycuick's measurements, for example, cover birds flying below 200 m.
- We do not know from how far a real bird's wingbeat can be heard from a mast; in the film we made it audible as a design choice.
Frequently asked questions
Can a camera alone tell a bird from a drone?
Not reliably from one frame at range: in our worked example, a 0.35 m drone and a starling at 400 m are the same blob of about 13–14 pixels. Without range, the decision has to rest on the track's shape over time.
Which track features give a drone away?
No wingbeat pulse, straight flight at constant speed, hovering, and sliding sideways without turning. None is enough alone, because kestrels hover and gliding birds do not flap; the decision is a confidence score that builds up along the track.
Why is acoustic detection extra evidence?
It measures a physical event independent of the image: a rotor produces a narrowband series at its blade passing frequency and harmonics, which haze does not affect. With short range and wind sensitivity, it works next to the camera, not instead of it.
Why is this processing done on the mast?
A pulse a few pixels wide is easily smoothed away by video compression, and the microphone channels must stay sample-aligned. Computation next to the sensors keeps working when the link drops; so the metric is fps per watt, and for the operator, glass-to-glass delay.
Sources
- Pennycuick (2001), Speeds and wingbeat frequencies of migrating birds compared with calculated benchmarks: wingbeat frequencies and wingspans of 16 species.
- Svanström et al. (2021), Real-Time Drone Detection and Tracking With Visible, Thermal and Acoustic Sensors: pan/tilt system, late fusion, acoustic range review.
- Cabell et al. (2016), Measured Noise from Small Unmanned Aerial Vehicles: NASA Langley; blade passing frequency harmonics.
- Shulman (2026), EchoHawk: A Reproducible Acoustic Pipeline for Drone Detection, Classification, and Direction-Finding, with a Cautionary Study of Session-Level Data Leakage: preprint; blade passing frequency, harmonic confusers, limits of acoustics, data leakage.
- HyperPhysics, Beat Frequencies: beat frequency.
- HyperPhysics, Speed of Sound in Gases: 343 m/s at 20 °C.
- Knapp, Carter (1976), The generalized correlation method for estimation of time delay: classic time-delay estimation.
- Beckers et al. (2003), Pure-tone birdsong by resonance filtering of harmonic overtones: pure-tone birdsong.
- RSPB, Kestrel: kestrels hunting by hovering.
- Rahman, Robertson (2018), Radar micro-Doppler signatures of drones and birds at K-band and W-band: micro-Doppler signatures.
- Bachhuber, Steinbach (2016), A system for high precision glass-to-glass delay measurements in video communication: glass-to-glass delay.
Sources accessed on 26 September 2026.